
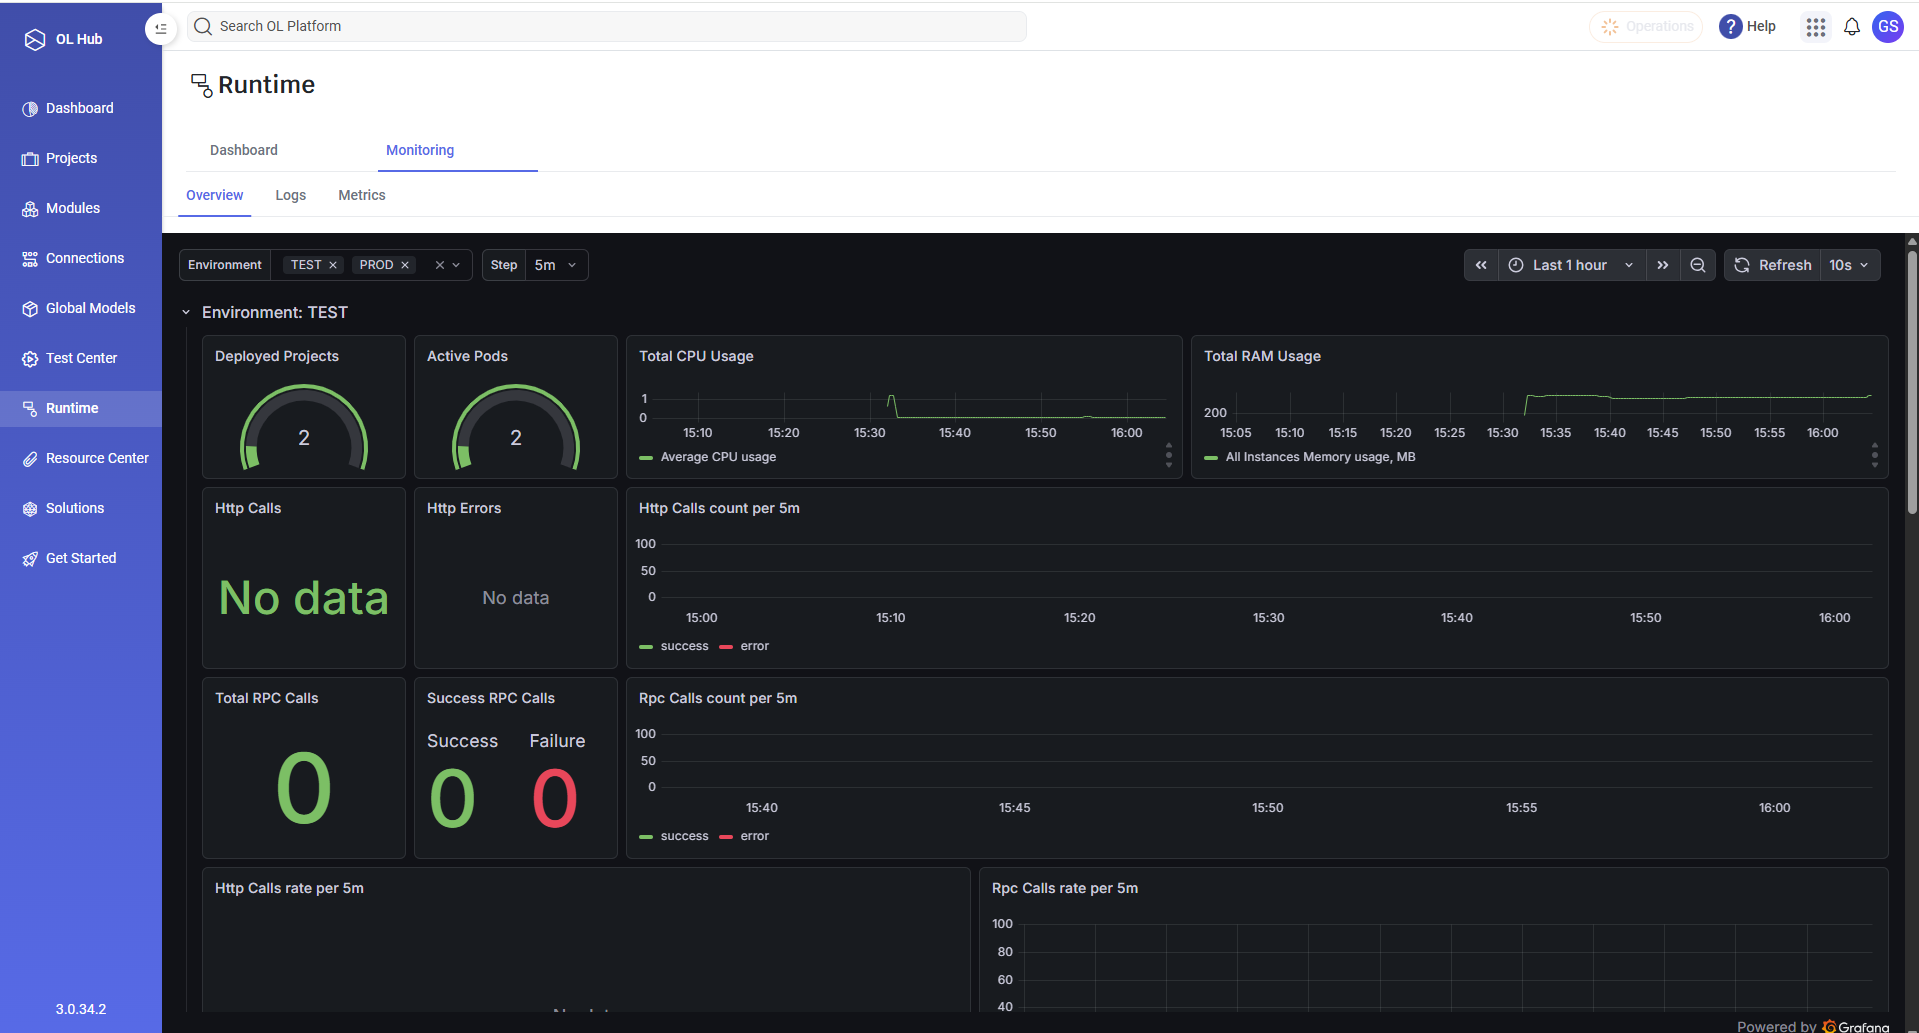
Runtime Dashboards (Grafana)
Monitor deployed Hub APIs with Grafana—metrics, logs, and Runtime dashboards scoped by project, tenant, and environment.
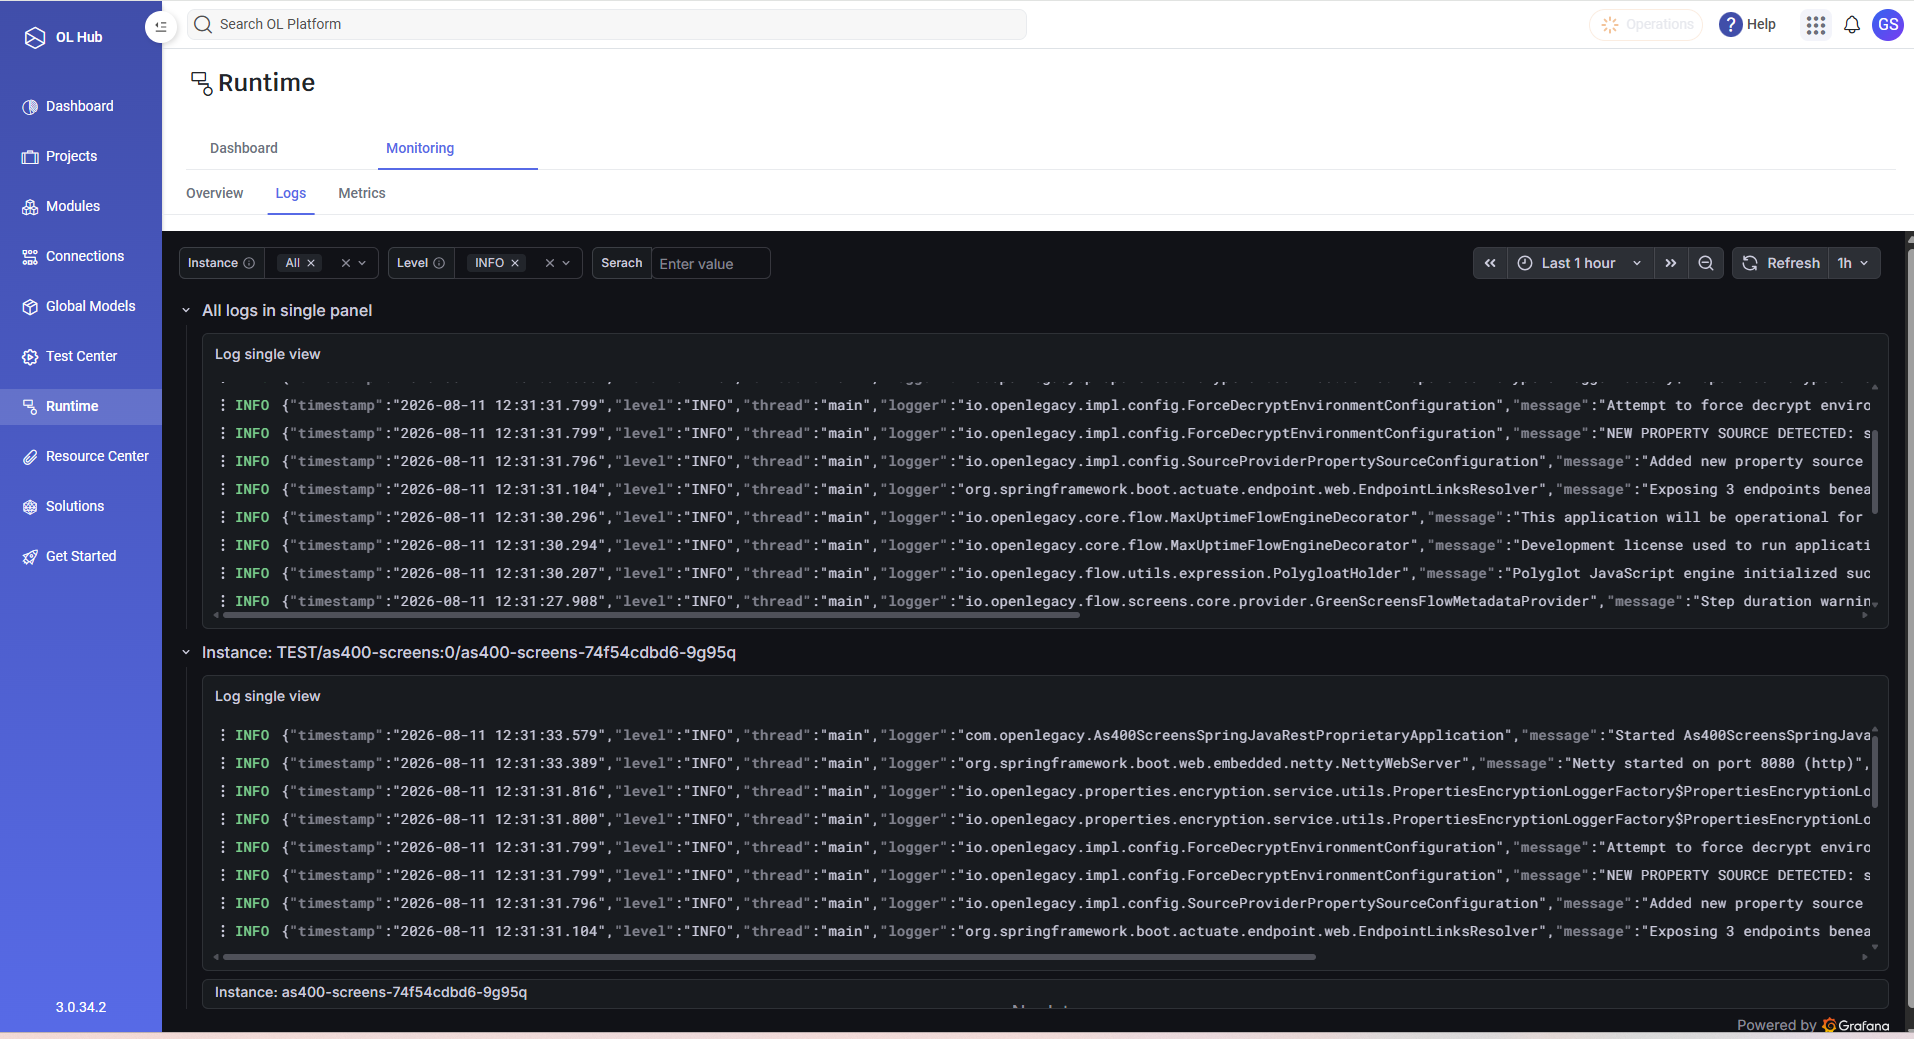
OL Integration collects runtime stats for deployed APIs and surfaces them through Grafana dashboards—embedded in Hub (SaaS Runtime → Monitoring) or via the enterprise monitoring bundle (Prometheus, Loki, Grafana).
A dedicated grafana-proxy authenticates Hub users (JWT), provisions per-tenant Grafana orgs, and scopes dashboards so tenants only see their own project/environment data.